Reports
- Pablo Cappelletto (Deactivated)
VIC Occupancy Rate and Revenue Report
This report provides a thorough flight revenue analysis . It shows relative information according to the status of the flight at the time of the inquiry.
The information displayed varies depending on whether it is requested:
1. Prior to the departure of a flight or,
2. After the flight closed at check-in.
Pre-Check-In Information
The command to obtain this report is the following:
VICFlight/Date
Example:
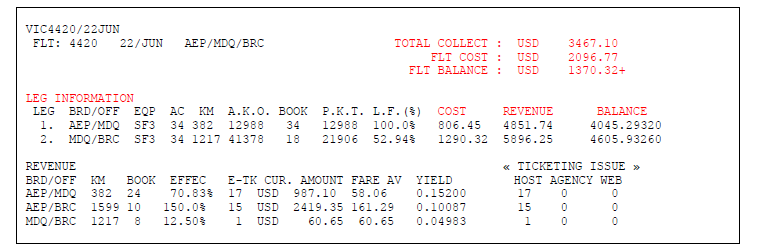
VIC4420/22JUN
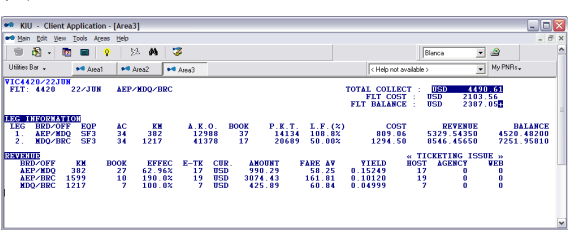
FLT | Flight number |
DATE | Departure date |
ROUTING | Flight routing |
TOTAL COLLECT | Ticket total amount collected |
FLT COST | Total flight cost loaded in the table |
FLT BALANCE | Flight balance, obtained from the difference between "Total Collect" and "Flt Cost" |
LEG INFORMATION
LEG | Leg order number |
BRD/OFF | BRD Origin OFF Destination |
EQP | Equipment |
AC | Actual equipment capacity |
KM | Distance between origin/destination (in km) |
A.K.O | Seats per kilometer offered |
BOOK | Number of passengers per leg |
P.K.T. | Passenger Kilometer Traveled |
L.F | Load factor |
COST | Prorated cost by leg |
REVENUE
BRD /OFF | BRD Origin /OFF Destination |
KM | Distance between origin and destination |
BOOK | Number of passengers |
EFFEC | Effective Passengers Booked/Ticketed |
E-TK | Number of e-tickets issued |
CUR. | Currency |
AMOUNT | Ticketed total amount |
FARE AV | Average fare |
YIELD | YIELD . This value is obtained by dividing the value of the Total Collect by the P.K.T (Passenger per Km Traveled) |
«TICKETING ISSUE» | Tickets issued |
HOST | Tickets issued in the host |
AGENCY | Tickets issued by travel agents |
WEB | Tickets issued from the web page |
When dealing with flights with intermediate stops in order to obtain the flight balance ,the cost values must be charged for each of the legs, otherwise the total balance thereof can not be calculated.
Post Check-In Information
Example: VIC5200/13JUN
The command that must be entered to check this report is the following:
VICflight number/date
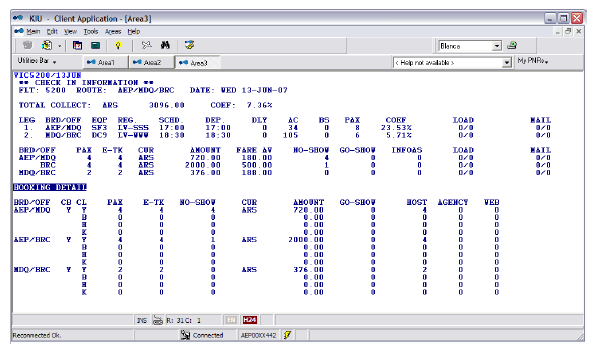
General flight information
FLT | Flight number |
ROUTE | Complete routing |
DATE | Flight date |
TOTAL COLLECT | Total amount collected |
COEF | Load Factor |
LEG | Order number of each section |
BRD OFF | BRD:Origin OFF: Destination| |
EQP | Equipment |
REG | Registration |
SCHD | Scheduled departure time |
DEP | Actual departure time |
DLY | Delay |
AC | Aircraft capacity |
BS | Space Block |
PAX | Booked passengers by Leg |
COEF | Load factor(percentage) |
LOAD | Load |
Information by marketing segments
BOAD/OFF | BRD:Origin OFF: Destination| |
PAX | Passenger |
E-TKT | E-ticket |
CUR | Currency |
AMOUNT | Total ticked amount by segment |
FARE AV | Average fare |
NO-SHOW | No-show passengers |
GO-SHOW | Go-Show passengers |
INFOAS | Infant passengers |
LOAD | Cargo |
Mail. |
Booking Details
BOAD/OFF | BRD:Origin OFF: Destination| |
CB | Cabin |
CL | Class |
PAX | Passenger |
E-TKT | E-ticket |
NO-SHOW | No-show passengers |
CUR | Currency |
AMOUNT | Total ticked amount by segment |
GO-SHOW | Go-Show passengers |
HOST | Tickets issued in the host |
AGENCY | Tickets issued by travel agents |
WEB | Tickets issued from the web page |
Flight Post Check-in information with Upgrades / Downgrades
In case a flight checked contains upgrade and /or downgrades, the VIC report will contain other columns that will optimize the analysis. The columns are:
BOOK Number of reservations in each class


UPG / DWG: Number of upgraded or downgraded passengers in each class:


FROM: Number of passengers that had reservations in another class, and that due to an upgrade or downgrade were checked in that class.


TO: Number of passengers that had reservations in that class, and that due to an upgrade or downgrade were checked in another class.
Example:
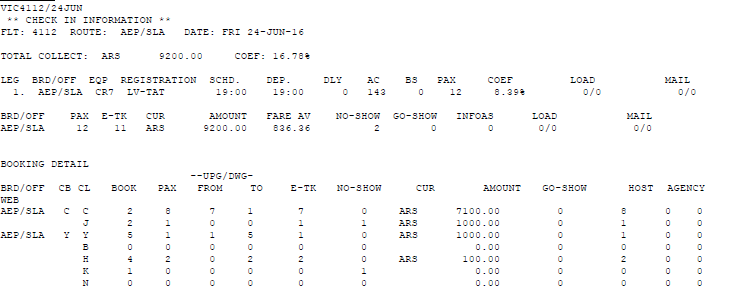
Description:
Class C: I had 2 reservations (BOOK). 8 passengers flew in this class (PAX). 7 passengers had upgrade. 1 passenger had a downgrade.
Class J: I had 2 reservations (BOOK). 1 passenger flew in this class (PAX).
Class Y: I had 5 reservations (BOOK). 1 passenger flew in this class (PAX). 1 passenger had upgrade. 5 passengers had downgrade.
Class H: I had 4 reservations (BOOK). 2 passengers flew in this class (PAX). 2 passengers had downgrade
Cost table
This functionality allows the administration of the "Cost Table " in reference to the different sections of the airline. Values assigned to the Cost Table will be reflected, in the VIC statistical report, in a comparative way with the collection of the flight.
Note:
The user must have duty code 6 or 8 in order to perform this command
Add items
To enter the costs for each leg and period, the following command should be entered:
TFC / A- {Origin} {Destination} {-} / {date from} - {date to} / {currency} {amount}
Description:
TFC / A- | Fixed command to add a new item. |
Origin | Origin airport code |
Destination | Destination airport code |
| The middle dash in this position indicates that the value will not be loaded in the reverse direction. By default it charges the amount in both directions. |
/ | Slash |
From Date | First date to display |
- | Dash to split dates range |
Up To Date | Last date to display |
/ | Slash |
Currency | ISO currency code |
Amount | Amount |
Example:
TFC/A-EZELPB/1NOV-30NOV/USD4500
Add items indicating equipment
You can add a cost table by type of aircraft that operates the route. To indicate an aircraft type, the equipment indicator should be inserted between the section and the date, as shown below:
TFC/A-(Origin /Destination)/E(Equipment id)/(date -from)-(date to)/(currency)(amount)
Example:
TFC/A-EZELPB/E737/1NOV-30NOV/USD4500
Notes:
Field E (equipment) is optional. If this field is not entered, the cost will apply to all equipments.
After the E indicator E, the equipment should be entered in the DNE field. For example: 733 for the 737-300 aircraft-
Delete Items
To delete costs added for a section, the following command must be entered:
TFC/D-items
TFC / D- | Fixed Command to delete items. |
Items | Item number (depending on the table display) that you wish to delete. |
Note:
Several items can be indicated separated by comma or with hyphens (to indicate ranges).
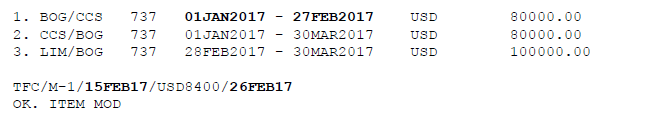
Modify Items
TFC/M-7/30NOV15/USD4500
TFC / M- | Fixed command |
M | Modify indicator |
- | Hyphen |
7 | Item number to modify |
/ | Slash |
30NOV15 | New effective date |
/ | Slash |
USD4500 | New cost |
A cost can also be modified for a period of time, provided that this period is within the time range of the item to be modified.
Check the cost table
The following command must be performed in order to check the cost table:
TFC*
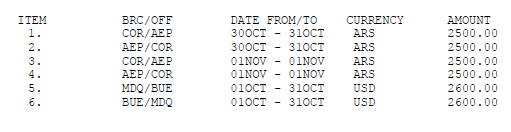
Table Display
Description:
ITEM | Item number |
BRD / OFF | Segment origin and destination |
DATE FROM / TO | Effective date |
CURRENCY AMOUNT | Currency amount added as cost. |
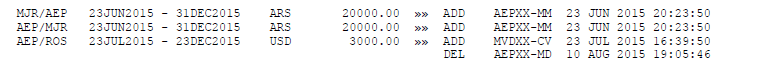
History
In order to verify the values history added in the cost table you must enter the following command;
TFC/H
Example:
Cost table applied to VIC report
Once the Cost Table has been generated, the system will automatically calculate the pre-established values as expenses and calculate the amounts collected by flight and leg, cost of the flight, balance of the flight and each leg-
Note:
In order to obtain the calculations mentioned above, you must have the cost table with the values charged for each leg.
Example:
Description:
Total Collect | Total amount collected on the flight |
Flt Cost | Total amount of cost added to the table |
Flt Balance | Flight balance. Difference between total collect and flight cost |
Leg information | Cost and balance information detailed by leg |
Cost | Amount of the flight leg cost added to the the table |
Revenue | Amount collected in the flight leg, obtained from the income prorated by legs |
Balance | Leg Balance obtained from the difference between "Cost" and "Revenue" |
TBR7 Total Booking Report
This report provides the number of bookings (passengers booked per leg ) active in the host acting in advance up to 330 days.
General
To obtain a report of all booked passengers including waiting lists, subject to space and requested on all operated routes, the command is as follows:
TBR7ALLALL
The ALL ALL indicator emphasizes that all origins and all destinations are considered.
This report provides the data all the routes operated by the carrier during a period of time from the current date up to 330 days in advance. The number of reservations is described by day and month, totaling at the end of the month.
At the end of the display you can see the signature, date and time stamp.
DEP: Origin. Airport / ALL (all)

ARR: Destination. Airport / ALL (all)

FLT: Flight

DATES RANGE: Dates Range included in the display (330 days)
Report by Origin / Destination
The report can be requested by origin and destination, or only origin or destination.
The commands are:
TBR7AEPSLA Origin / destination

TBR7AEPALL Only origin (from AEP to all destinations)

TBR7ALLAEP Only destination (from all airports to AEP))
Report by Flight
A booking report can be obtained by specified flight with the following command:
TBR7ALLALL/4104
| TBR7 | Fixed command |
| ALLALL | All origins to all destinations |
| / | Slash |
Report by reservation status
You can request a report by booking status with the following command:
TBR7ALLALL*K
| TBR7 | Fixed command |
| ALLALL | All origins to all destinations |
| * | Asterisk |
| K | Confirmed status indicator |
Report by Host, Agency or other GDS
You can request a bookings report detailed by Host or travel agencies.
The command to obtain a booking report created in the agencies is the following:
TBR7ALLALL#A
This command only allows to display bookings generated only by travel agencies.
| TBR7 | Fixed command |
| ALLALL | All origins to all destinations |
| # | Hash tag |
| A | travel agency indicator |
The command to obtain the booking report created in the host is:
TBR7ALLALL#H
This command only provides data of bookings generated only by the host.
Description:
| TBR7 | Fixed command |
| ALLALL | All origins to all destinations |
| # | Hash tag |
| H | Host indicator |
The command to obtain a booking report created by another GDS:
TBR7ALLALL#G
This command allows you to display booking generated from office Subtype Z, which is the one that receives the PNRs from another GDS.
Description:
| TBR7 | Fixed command |
| ALLALL | All origins to all destinations |
| # | Hash tag |
| G | GDS indicator |
Combinations
Both origin / destination report ,flight number or status can be combined, therefore, a route, origin or destination of a specific flight for confirmed passengers could be requested.
To generate the report, with the mentioned combinations, you must enter the following command
TBR7AEPSLA/4104*K
Description:
| TBR7 | Fixed command |
| AEPSLA | (Route)Origin and destination |
| / | Slash to split vendor type |
| 4104 | Flight number |
| * | Status divider |
| K | Confirmed status |
Export Report to Excel
Any of the report options can be sent to EXCEL spreadsheets.
The command to export the report is as follows:
TBR7ALLALL-EXCEL
You must enter the corresponding report request adding it -EXCEL at the end. You can also apply this method with the TBR reports that follow.
TBR8 Load Factor Report by legs
This report provides data of load factors for future flights by legs in an pop up screen.
The command to generate this report is the following:
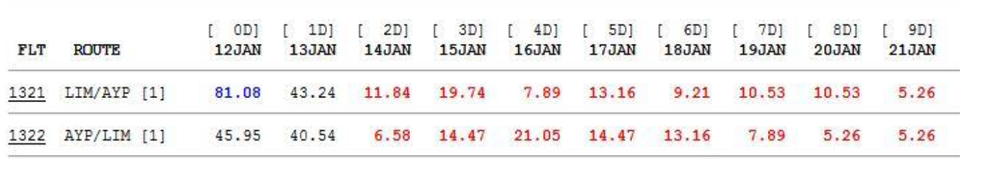
TBR8
Example:
Description:
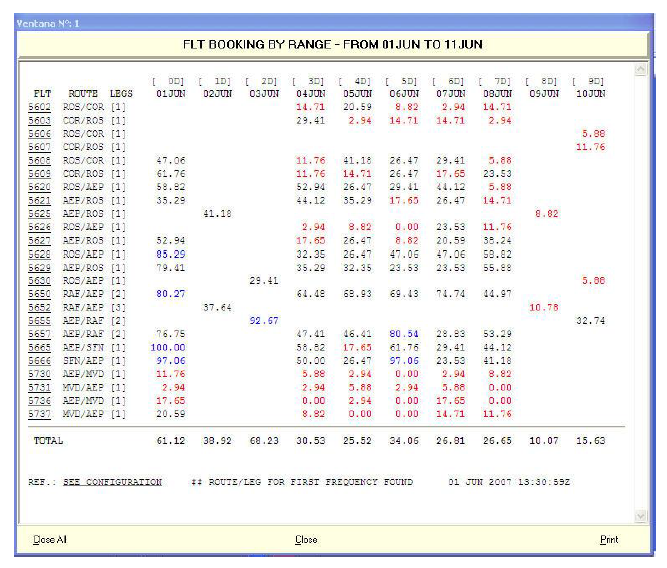
| FLT | Flight numbers that operate on a flight schedule. When ticking on a specific flight number, the system displays the flight plan information on the screen. This is the same information displayed by the DO (flight) / date command. |
| ROUTE | Origin, flight destination and flight leg number |
| [] | Number of days left for the departure of flights. Example: [1D] 1 da |
| DATE | In advance, up to 10 days from the day the report is checked, date by date, the occupation percentage for each of them will be displayed. |
| TOTAL | Total load factor considering all flights of each specific day. |
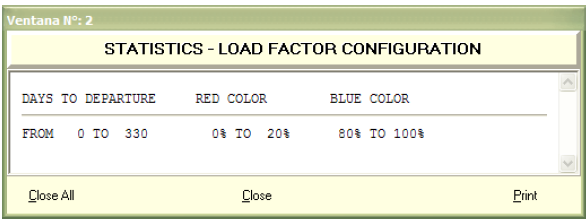
| SEE CONFIGURATION | When clicking on this link, the Statistics- Load Factor Configuration screen will open. The display will show the flight load factor identified in red, when they are below the value set by the airline, and in blue for those that are above set value. These load factor values, maximum and minimum are configured according to the company |
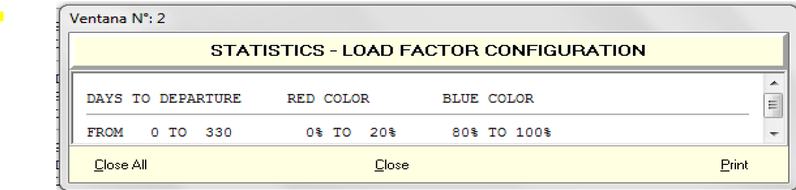
Description:
Considering the data displayed on this screen as an example, the RED COLOR column indicates that legs with 0% to 20% occupancy will be identified in red; and in the BLUE COLOR column legs with load factors between 80% and 100% occupancy will be identified in blue.
Considerations:
Flight stops will be listed and indicated in square brackets following the detail of each stop.
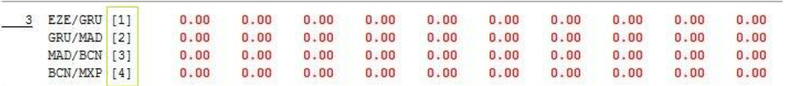
The days that the flights do not operate instead of being blank are displayed with a dotted line to improve the overall interpretation of the report
When a flight does not operate in the requested date instead of playing it as black ,a dotted line will be displayed.
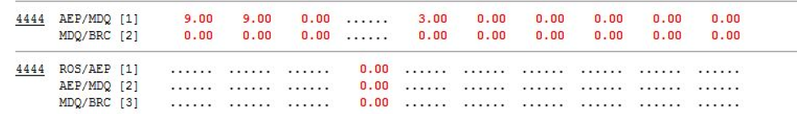
Along the weekly frequency a flight can have different stops so a flight information line will be generated for each route, in this way the interpretation of the flight load factor can be done individually.
Report by date display.
To display a report from a specific date, you must enter the following command:
TBR8/DATE
If a specific date is not entered the system will default to current date of the request and shows up to 10 days in advance.
Display by flight range
The report can be generated to check a specific flight range .
Example:
TBR8/30SEP/2100-2200
TBR8/2100-2200
You can enter the date filter explained above. This filter is optional and if it is indicated the system assumption applies for the current date.
Display by frequencies
A report by frequencies can be generated according to the days of the week .When this option is requested, the system will display the next 10 days that match the frequency.
The days of the week will be identified with the initials of the word in English: MO: Monday, TU: Tuesday, WE: Wednesday, TH: Thursday, FR: Friday, SA: Saturday, SU: Sunday. The days of the week can be combined
TBR8*WETHSU
Sending reports by mail
You can send report information by mail using this command:
TBR8-MAIL@MAIL.COM
Filter combination
All previous filters can be combined
TBR8/20OCT/1000-1300*SU-HOST@KIUSYS.COM
TBR9 Load Factor Report
This report displays a pop up with future flights load factor.
The command to generate this report is the following:
TBR9
Description:
| FLT | Scheduled flight numbers. When clicking on any specific flight the VIC report will be displayed with the load factor and revenue. |
| ROUTE | Origin, flight and destination |
| LEG | Number of legs |
| [] | Number of days left for the departure of flights. Example: [1D] 1 day |
| DATE | In advance, up to 10 days from the check day, date by date, the occupation percentage for each of the flights will be displayed. |
| TOTAL | Total load factor considering all flights of each specific day. |
| SEE CONFIGURATION | When clicking on this link, the Statistics- Load Factor Configuration screen will open. The display will show the flight load factor identified in red, when they are below the value set by the airline, and in blue for those that are above set value. These load factor values, maximum and minimum are configured according to the company |
Description:
Considering the data displayed on this screen as an example, the RED COLOR column indicates that legs with 0% to 20% occupancy will be identified in red; and in the BLUE COLOR column legs with load factors between 80% and 100% occupancy will be identified in blue.
Note:
The percentages to be shown for each color are configured according to carrier´s requirement.
Display by date
To display a for a specific date, you must enter the following command:
TBR9/DATE
This entry will display 10 days in advance from the requested date.
By not entering a specific date, the system will default to the current date of the request and up to 10 days in advance.
Display flight parameters
The report can be generated to check a specific range of flights.
To generate the report only for a range of flights, you must enter the following command:
TBR9/flight range
Example:
TBR9/1JAN07/5600-5650
TBR9/5650-5690
You can enter the date filter explained above. This filter is optional and if it is not enter they system assumption is the current date.
Notes:
- When the TBR9 command is executed and the system response is "TOO LONG", a range of flights must be specified to narrow the search and decrease the number of responses.
- A link in the flight number executes the DO command and allows you to see the full route of the flight.
Send the report by email
The report can be sent to an email address with the following command;
TBR9-MAIL@MAIL.COM
TBR1 Created PNRs Report
This report allows retrieving the new created PNRs, from the current date backwards, without including changes
The command displays up to 45 days back from the date of execution.
The options to generate the report are the following:
General
This report displays you the number of bookings (record locator)created in each of the cities that belong to the airline host.
This report displays the number of bookings created in each of the cities in the airline host.
The command to check this report is the following:
TBR1
Below the first column each of the cities will be displayed and in the next column the number of amount of PNRS created in each one of them will be displayed.
iIf no date is indicated the command default is the current day.
Filters
- Date
The same report can be requested indicating a specific date. The options are the following:
TBR1 / 10AUG By specific date
TBR1 / 1JUL-20JUL Per period of dates (covers up to 31 days)
TBR1 / AUG Per month
A pie chart and ordered information are obtained. Keep in mind that you can not overlap the days, for example you can not enter a parameter that is 01JUN - 01JUL for more than 31 days between them. You can also clarify the year in this display.
Example: 01AUG17
City
This report displays the number of reservations (record locator) created in a specific city by discriminating each of the offices that belong to that city and that create those bookings.
The command is the following:
TBR1CTY
Example: TBR1BUE
This command defaults to the date of request. It can be requested by specific date using the same format as in the GENERAL item.
- Office
This report displays the number of reservations (record locator) created in a specific city by discriminating each of the user that created them.
The command to generate the report is the following:
TBR1OFFICE
Example:
TBR1BUEXX-MM
This command defaults to the date of request. In response you obtain the signature, last and and first name of each agent and the number of bookings created by each of them.
It can be requested by date using the same format as the GENERAL item.
Agent
The command to visualize the report with these characteristics is the following:
TBR1AGENT
Example:
TBR1BUEXX-MM
This command defaults to the date of the request. In response, the amount of bookings created by the agent and a bar graph are obtained and detailed per day.
It can be requested by date using the same format as the GENERAL item.
You can also view the detail of the PNRS made by each user.
The command to visualize the report with these characteristics is the following:
TBR1 USER * / DATE
Example:
TBR1COR8R-M/1FEB
Description:
| TBR1 | Fixed command |
| COR8R | User from specific office |
| * | indicates that an active PNR from the user |
| / | Slash |
| 01FEB | Check date |
Note:
It must be taken into account that there may be a discrepancy between the number of PNRs listed in the TOTAL column, when using the CITY filter and the number of PNRs listed using the USER filter.
This discrepancy is due to the fact that the system is taking into account the GMT time and when requesting PNRs details made by each user, the system lists the PNRs made on the requested date considering the Local Time of the office to which the user belongs.
For example, if in the application the 2FEB day, per office, PNRs are listed, and when the information is broken down by user, there is no data or there is a discrepancy due to the fact that the PNRs were made on 01FEB day from 9:00 p.m.
TSR1R E-Tickets issued in Host Report
This report allows retrieving the E-TICKETS issued with the total amounts from the current date backward.
The command allows you to view up to 7 days back from the current date.
Note: Voided documents (VOID) are not included in this report.
The options to generate the report are the following:
General by country
This report displays the number of electronic tickets issued in general differentiated by country belonging to the host of the company.
The command to generate the report is the following:
TSR1
Response:
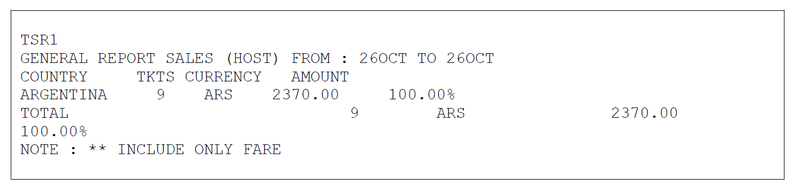
A pop up is displayed with a pie chart with the information, as shown in the following image:
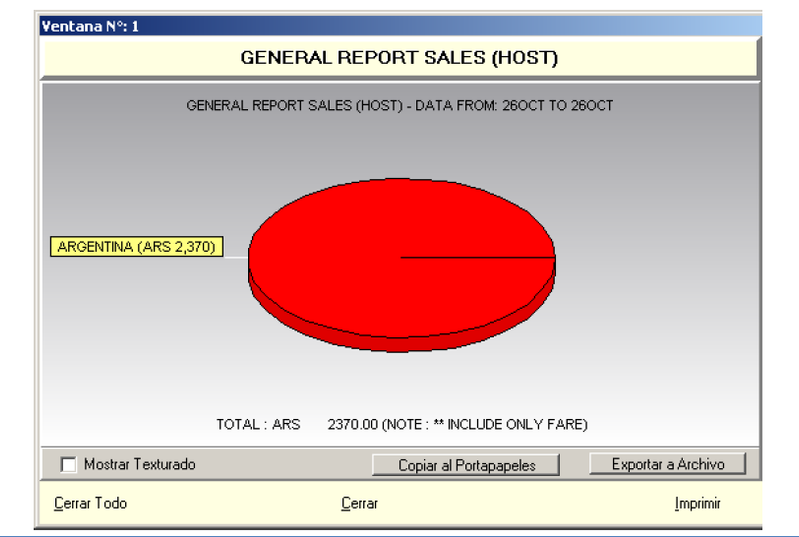
At the bottom the chart displays the total. This command defaults to the request date.
You can request the same report by specific dates.
The date options are valid for all reports of the same style (TSR) and are the following:
TSR1 / 10AUG By specific date (one day only)
TSR1 / 10JUL-15JUL Per period of dates
Note:
In all options,a pop up with a graphic is displayed.
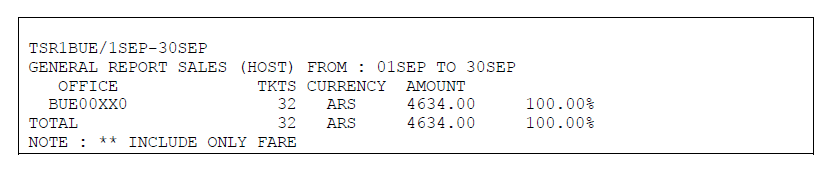
By City
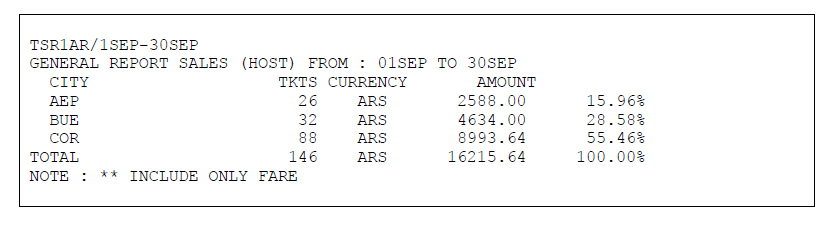
To visualize the report detailed by cities breakdown the following command should be entered:
TSR1COUNTRY
Example: TSR1AR
Response:
By office
To visualize the report detailed by office breakdown in a city, the following command should be entered:
TSR1City
Example:
TSR1BUE
Response
TSR2 Ticket issuance by Travel Agencies Report:
This report allows retrieving the E-TICKETS issued by travel agents with the total amounts from the current date backward.
The command allows you to view up to 7 days back from the current date.
Note: Voided documents (VOID) are not included in this report.
The options to generate the report are the following:
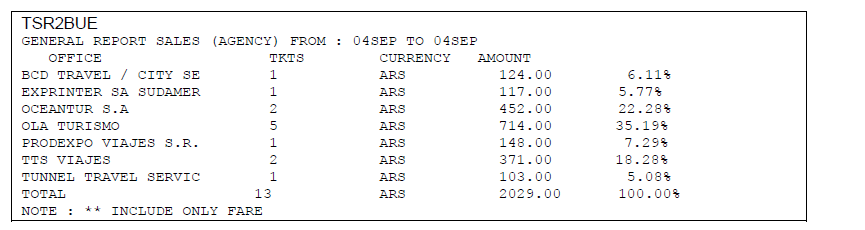
General by country
This report displays the number of electronic tickets issued by travel agencies by country breakdown.
The command to generate the report is the following:
TSR2
Response:

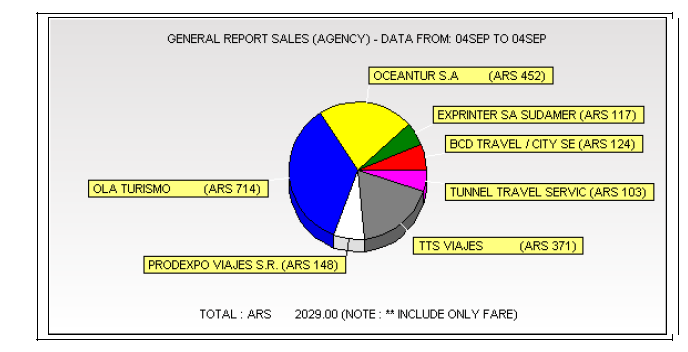
Note:
In all options,a pop up with a pie chart with data is displayed.
You can request the same report by specific dates. The date options are valid for all reports and are the following:
TSR2 / 10AUG By specific date (single day only)
TSR2 / 1JUL-7JUL Dates range
For all options a pop up is displayed.
By City
To visualize the report detailed by cities breakdown the following command should be entered:
TSR2COUNTRY
Example:
TSR2AR
By Agency
TSR2City
Example:
TSR2BUE
Chart
By Agency Type ( BSP and NON-BSP)
To display a sales report of BSP agencies only, the command is:
TSR2#B
To display a sales report of NON-BSP agencies only, the command is:
TSR2#N
These filters #B and #N can be combined with the other options such as country, city, date and / or date range.
Printing Command
To print any of the commands explained above, you must execute the same command by adding / PRINT at the end of it.
Example:
TSR2BUE/PRINT
Display without graphics
You can also display any of the commands preventing the system from generating graphics. Consequently only the requested list will be returned as a response.
Example:
TSR2BUE / NG
Display with graphics
You can display any of the commands requesting the system to show graphics if by default it is deactivated.
TSR2BUE/SG
TSR5 Form of Payment Report
This report displays payment methods used for all ticket issued. The detail is shown by the total tickets issued.
The command displays up to 7 days back from the current date.
Important:
Keep in mind that in the QTY column the number of documents issued will be counted, but in case of an ticket with more than one form of payment the ticket will be considered as many times as number of payment forms have been used.
In addition, the voided documents (VOID) are not included in this report.
The options for generating the report are the following:
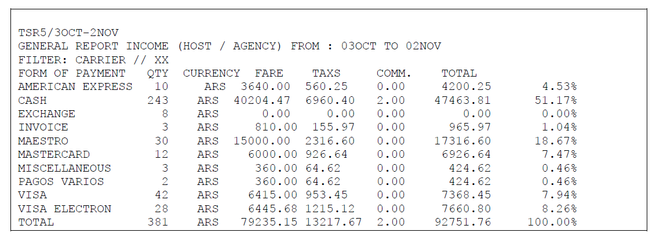
General
This report provides the number of electronic tickets issued according to the payment methods.
The command to generate the report is the following:
TSR5
A pie chart is also displayed with the data.
You can request the same report by specific dates. The dates options are valid for all reports and are the following:
TSR5 / 01NOV By specific date (a single day)
TSR5 / 1OCT-16OCT Dates range
For all options a pop up is displayed.
Example:
General by country
In order to display country specific data the following command must be made:
TSR5CountryCode
Example;
TSR5AR
In response, a sales report of the requested specific country and the corresponding graphics are shown. You can use all the dates options explained in the General concept.
By City
To display the report detailed by cities breakdown the following command should be entered:
TSR5city
Example:
TSR5BUE
By office
To display a report with the data of a specific office, the following command should be entered:
TSR5office
Example:
TSR5BUE00XX1
In response, a sales report of the requested specific office and the corresponding graphics are shown. You can use all the dates options explained in the General concept.
By user(Host only)
To display a report with all the data of a specified user the following command must be used(Only for airline host agents)
TSR5user
Example:
TSR5BUEXX-MM
In response, a sales report of the requested user and the corresponding graphics are shown. You can use all the dates options explained in the General concept.
By Form of payment generated in the Host
At the same time forms of payment can also be detailed for sales generated in the host only.An extension can be added at the end to the former examples in order to identify the host.
The command to be used is the following;
TSR5city#H
Example:
In this example, forms of payment of sales generated in the Host and city BUE are displayed. In the same way it could be obtained by country.
In response, we obtain a sales report where of the requested user only and the corresponding graphics are shown. You can use all the options of dates explained in the General concept.
By Form of payment generated in travel agencies.
You can also sort sales by forms of payment generated in agencies only .You can use any of the previous examples, adding an extension at the end that identifies travel agencies.
The command to be used is the following;
TSR5city#A
Example:
TSR5BUE#A
In response, we obtain a sales report with form of payment generated in BUE agencies and the corresponding graphics are shown. You can use all the options of dates explained in the General concept.
Printing Command
To print any of the commands explained above, you must execute the same command by adding / PRINT at the end of it.
Example:
TSR5BUE/PRINT
Display without graphics
You can also display any of the commands preventing the system from generating graphics. Consequently only the requested list will be returned as a response.
Example:
TSR5BUE / NG
Display with graphics
You can display any of the commands requesting the system to show graphics if by default it is deactivated.
TSR5BUE/SG
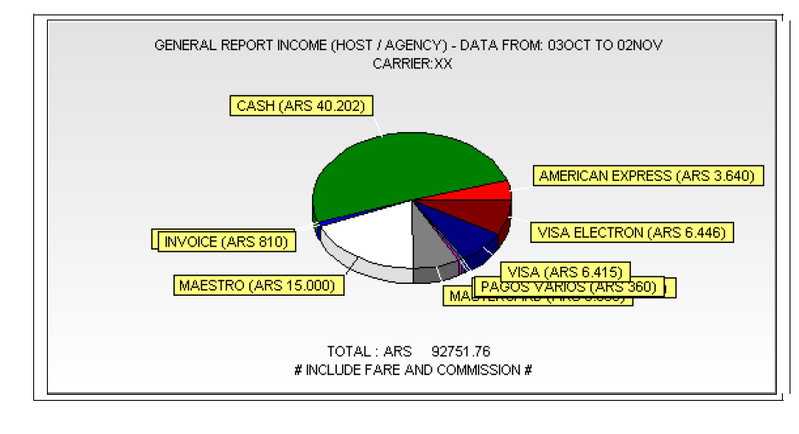
TSR6 Document Types Report
This report provides the data of documents types used for all tickets issued . The detail is shown by the total tickets issued.
The command displays up to 7 days back from the current date.
Note: Voided documents (VOID) are not included in this report.
The options for generating the report are the following:
General
This report allows displaying the number of electronic tickets issued according to the documents types.
The command to generate the report is the following:
TSR6
A pie chart is also displayed with the data.
You can request the same report by specific dates. The dates options are valid for all reports and are the following:
TSR6 / 01NOV By specific date (a single day)
TSR6 / 1OCT-16OCT Dates range
For all options a pop up is displayed.
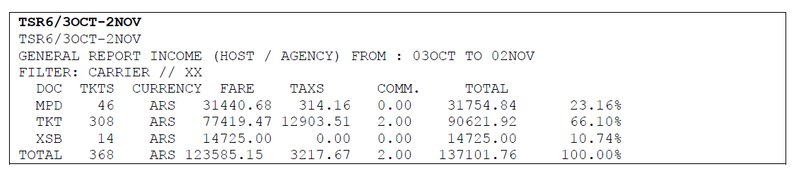
Graphics
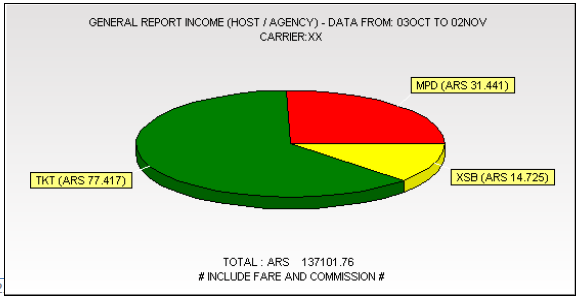
| MPD/MCO | Miscellaneous documents |
| TKT | Tickets |
| XSB | Baggage Excess charges |
By city
To visualize a report with data of a specific city enter the following command:
TSR6city
Example :
TSR6BUE
In response a report with sales for a specific city is obtained and the corresponding graphics are shown. You can use all the dates options as explained in the General concept.
By Office
To visualize a report with data of a specific office , enter the following command:
TSR6office
Example:
TSR6BUE00XX1
In response a report with sales for a specific office is obtained and the corresponding graphics are shown. You can use all the dates options as explained in the General concept.
By User (Host only)
To visualize a report with data of a specific use (own airline hosts agents) enter the following command:
TSR6user
Example:
TSR6BUEXX-MM
In response a report with sales for a specific user is obtained and the corresponding graphics are shown. You can use all the dates options as explained in the General concept.
Documents type generated in the Host
Morover , the documents generated in the Host can be detailed . In order to do so any of the previous examples can be used , adding an extension at the end that identifies the host.
The command that must be entered is the following:
TSR6city#H
Example:
TSR6BUE#H
In this example,documents generated in the Host and the city of BUE (Buenos Aires)are displayed. In the same way any of the parameters can be obtained , for example TSR6VE # H
Types of Documents generated through Travel Agencies
Morover , the documents generated through the travel agency channel can be detailed . In order to do so any of the previous examples can be used , adding an extension at the end that identifies travel agencies
The command that must be entered is the following:
TSR6city#A
Example:
TSR6BUE#A
In this example,documents generated through the travel agency channel are displayed. In the same way any of the parameters can be obtained , for example TSR6US#A
Printing Command
To print any of the commands explained above, you must execute the same command by adding / PRINT at the end of it.
Example:
TSR6BUE/PRINT
Display without graphics
You can also display any of the commands preventing the system from generating graphics. Consequently only the requested list will be returned as a response.
Example:
TSR6BUE / NG
Display with graphics
You can display any of the commands requesting the system to show graphics if by default it is deactivated.
TSR6BUE/SG
TSR7 Ticketing date versus Flight date comparison report.
This report allows comparing the date of issue against flight date of the first coupon of the ticket issued.
Note: Voided documents (VOID) are not included in this report.
The command to generate the report is the following:
TSR7
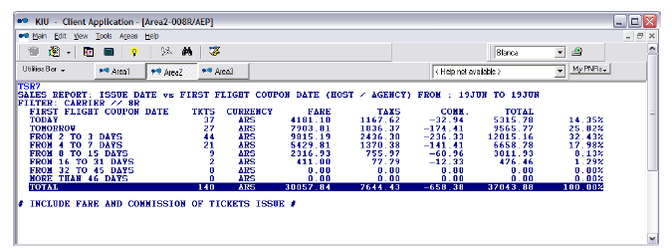
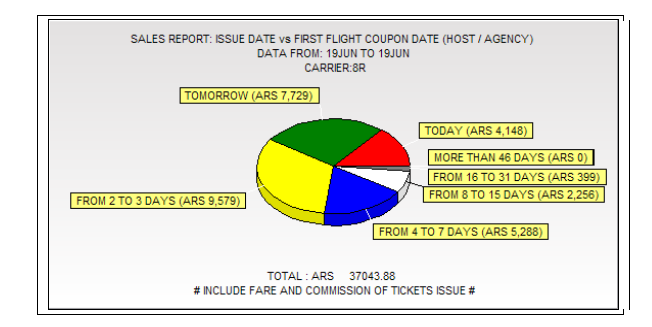
TODAY row represents all the tickets sold today to fly on the same day.
You can request the same report by specific dates. The dates options are valid for all reports of the same style in all your options and are the following:
TSR7 / 12JUN | By specific date, a single day |
TSR7 / 01JUN-8JUN | Per period of dates |
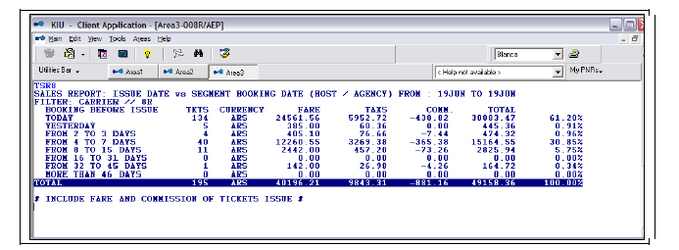
TSR8 Ticketing date versus Booking date comparative report.
This report allows comparing the date of issue against booking date of the first segment of the ticket being issued.
Note:
- Voided documents (VOID) are not included in this report.
- Booking date of the first segment is always taken into account.
The command to generate the report is the following:
TSR8
Graphics
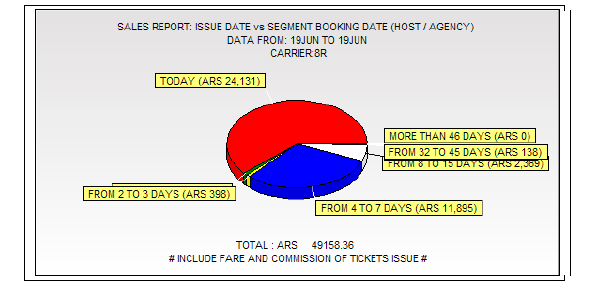
TODAY row represents all tickets sold today and which were booked today.
FROM 8 TO 15 DAYS row the tickets sold today and booked between 8 and 15 days ago are displayed.
You can request the same report by specific dates. The options of dates are valid for all reports of the same style in all your options and are the following:
TSR8 / 12JUN | By specific date, a single day |
TSR8 / 01JUN-8JUN | Per period of dates |
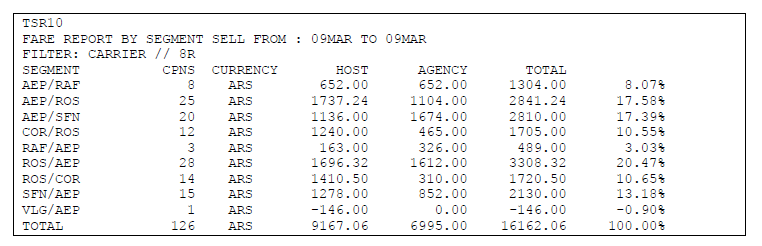
TSR10 Sold Segments Report
This report provides the data of segments sold and the incidence on the total sale volume.
It also allows you to view the sources of those sales generated.through the different filters
Important: This report does not reflect segments revenue but each coupon value for segments sold. Keep in mind that when there are several segments that involve a single fare the system prorates the value of each segment according to the distance between each point.
The command to generate the report is the following:
General
TSR10
Response:
A pop up with a pie chart is displayed.
Total sales volume is shown at the bottom . This command defaults to the request date.
You can request the same report by specific dates.
The date options are valid for all reports as shown next:
TSR10 / 12JUN | By specific date, a single day |
TSR10/ 01JUN-8JUN | Per period of dates |
Note:
In all options a pop up is displayed.
By country
In order to display country specific data the following command must be made:
TSR10CountryCode
Example;
TSR5AR
In response, a sales report of the requested specific country and the corresponding graphics are shown. You can use all the dates options explained in the General concept.
By City
To display the report detailed by cities breakdown the following command should be entered:
TSR10city
Example:
TSR10BUE
Response;
By Office
To visualize a report with data of a specific office , enter the following command:
TSR10office
Example:
TSR10AEP008R4
In response a report with sales for a specific office is obtained and the corresponding graphics are shown. You can use all the dates options as explained in the General concept.
Printing Command
To print any of the commands explained above, you must execute the same command by adding / PRINT at the end of it.
Example:
TSR10/PRINT
Display without graphics
You can also display any of the commands preventing the system from generating graphics. Consequently only the requested list will be returned as a response.
Example:
TSR10/NG
Display with graphics
You can display any of the commands requesting the system to show graphics if by default it is deactivated.
TSR10/SG
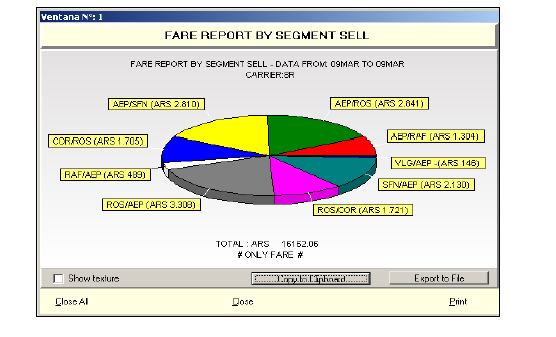
TSR11 Sold segments by point of sale report
This report provides the data of segments sold by point of sale. It also displays where those sales were generated based on the TSR10 report,through the different filters
This report displays segments sold and the incidence on the total sales volume.
Important: This report does not reflect segments revenue but the value of of each coupon for segments sold. Keep in mind that when there are several segments that involve a single fare the system prorates the value of each segment according to the distance between each point.
In addition Voided documents (VOID) are not included in this report.
The command to generate the report is as follows:
General
TSR11ROUTE
Response:
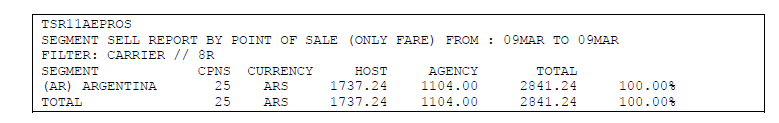
A pop-up is displayed with a pie chart with information displayed by country.
Total sales volume is shown at the bottom . This command defaults to the request date.
You can request the same report by specific dates. The options of dates are valid for all reports in all your options and are the following:
| TSR11AEPROS/10AUG | Date specific,single day |
| TSR11AEPROS/1JUL-07JUL | Date range |
Note:
A pop up with a pie chart is displayed.
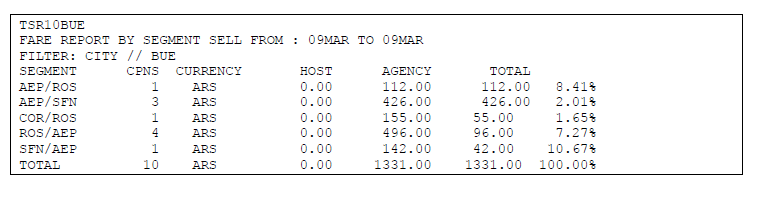
By City
To display the report detailed by cities breakdown the following command should be entered:
TSR11Route/country
Example:
TSR11BUEROS/AR
Response:
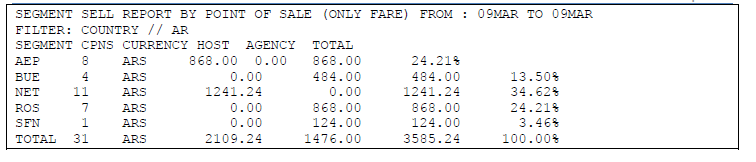
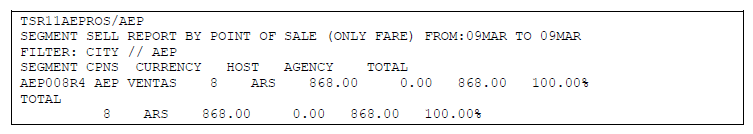
By Office
To visualize a report with data of a specific office , enter the following command:
TSR11AEPROS/BUE
City code must be indicated and the system will display the information for each of the city offices.
Example:
TSR11AEPROS/BUE
Response:
Printing Command
To print any of the commands explained above, you must execute the same command by adding / PRINT at the end of it.
Example:
TSR11AEPROS/PRINT
Display without graphics
You can also display any of the commands preventing the system from generating graphics. Consequently only the requested list will be returned as a response.
Example:
TSR11AEPROS/NG
Display with graphics
You can display any of the commands requesting the system to show graphics if by default it is deactivated.
TSR11AEPROS/SG
TSR12 Sales Report by Booking designator
This provides the data of how and where the different classes available for sale on flights were sold .
It also allows you to view the sources of those sales generated.through the different filters
Voided documents (VOID) are not included in this report.
Important: This report does not reflect income but the value of the each coupon per class sold. Keep in mind that when there are several segments that involve a single fare the system prorates the value in each segment according to the distance between each point.
The options for generating the report are the following:
General
TSR12
Response:
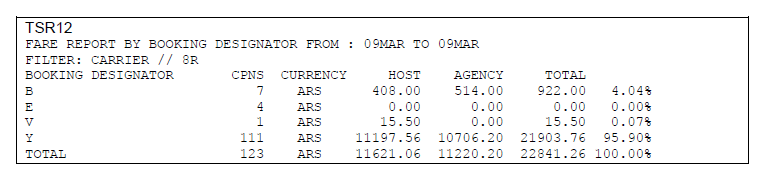
A pop-up is displayed with a pie chart with the data. .
Total sales volume is shown at the bottom . This command defaults to the request date.
You can request the same report by specific dates. The options of dates are valid for all reports in all your options and are the following:
| TSR12/10AUG | Specific date,single day |
| TSR12/1JUL-07JUL | Date range |
By country
In order to display country specific data the following command must be made:
TSR12CountryCode
Example;
TSR12AR
In response, a sales report of the requested specific country and the corresponding graphics are shown. You can use all the dates options explained in the General concept.
By City
To display the report detailed by cities breakdown the following command should be entered:
TSR12city
Example:
TSR12BUE
Example:
TSR12BUE
By Office
To visualize a report with data of a specific office , enter the following command:
TSR12Office
City code must be indicated and the system will display the information for each of the city offices.
Example:
TSR12AEP008R4
Printing Command
To print any of the commands explained above, you must execute the same command by adding / PRINT at the end of it.
Example:
TSR12/PRINT
Display without graphics
You can also display any of the commands preventing the system from generating graphics. Consequently only the requested list will be returned as a response.
Example:
TSR12/NG
Display with graphics
You can display any of the commands requesting the system to show graphics if by default it is deactivated.
TSR12/SG
TSR13 Booking class by point of sale
This report provides booking classes by point of sale .
It also provides the sources of those sales generated.through the different filters.
Voided documents (VOID) are not included in this report.
Important: This report does not reflect income but the value of the each coupon per class sold. Keep in mind that when there are several segments that involve a single fare the system prorates the value in each segment according to the distance between each point.
The options for generating the report are the following:
General
TSR13class
Example:
TSR13Y
Response:
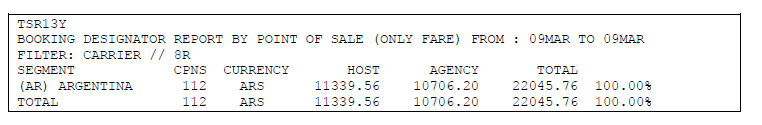
A pop-up is displayed with a pie chart with the data. .
Total sales volume is shown at the bottom . This command defaults to the request date.
You can request the same report by specific dates. The options of dates are valid for all reports in all your options and are the following:
| TSR13Y/10AUG | Specific date,single day |
| TSR13Y/1JUL-07JUL | Date range |
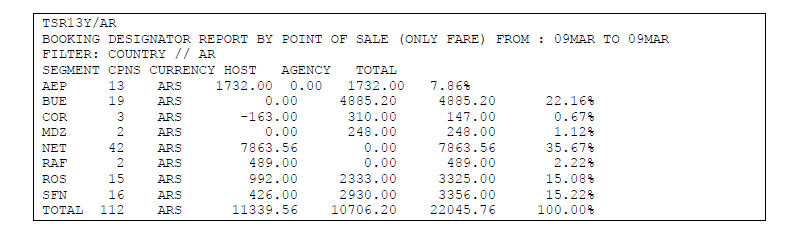
By City
To display the report detailed by cities breakdown the following command should be entered:
TSR13booking class/country code
Iso code must be specified and system will show all cities associated to that country.
Example:
TSR13Y/AR
Response:
By Office
To visualize a report with data of a specific office , enter the following command:
TSR13booking class/city
City code must be indicated and the system will display the information for each of the city offices.
Example:
TSR13Y/ROS
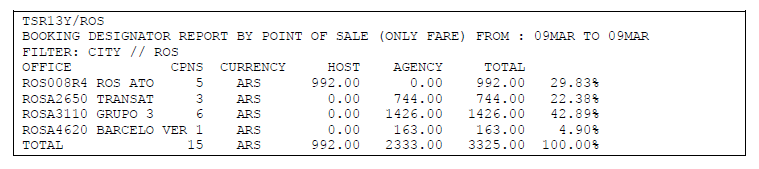
Printing Command
To print any of the commands explained above, you must execute the same command by adding / PRINT at the end of it.
Example:
TSR13/PRINT
Display without graphics
You can also display any of the commands preventing the system from generating graphics. Consequently only the requested list will be returned as a response.
Example:
TSR13/NG
Display with graphics
You can display any of the commands requesting the system to show graphics if by default it is deactivated.
TSR13/SG
TSR14 Sold Fare Basis Report
This provides the data of how and where the different fare basis were sold and the source where those sales were generated with different filters
Voided documents (VOID) are not included in this report.
Important: This report does not reflect income but the value of the each coupon per class sold. Keep in mind that when there are several segments that involve a single fare the system prorates the value in each segment according to the distance between each point.
The options for generating the report are the following:
General
TSR14
Response:
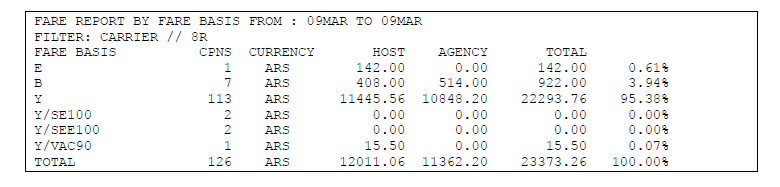
A pop-up is displayed with a pie chart with the data. .
Total sales volume is shown at the bottom . This command defaults to the request date.
You can request the same report by specific dates. The options of dates are valid for all reports in all your options and are the following:
| TSR15/10AUG | Specific date,single day |
| TSR14/1JUL-07JUL | Date range |
By country
In order to display country specific data the following command must be made:
TSR14CountryCode
Example:
TSR14AR
By City
To display the report detailed by cities breakdown the following command should be entered:
TSR14city
Example:
TSR14BUE
By Office
To visualize a report with data of a specific office , enter the following command:
TSR14Office
City code must be indicated and the system will display the information for each of the city offices.
Example:
TSR14AEP008R4
Printing Command
To print any of the commands explained above, you must execute the same command by adding / PRINT at the end of it.
Example:
TSR14/PRINT
Display without graphics
You can also display any of the commands preventing the system from generating graphics. Consequently only the requested list will be returned as a response.
Example:
TSR14/NG
Display with graphics
You can display any of the commands requesting the system to show graphics if by default it is deactivated.
TSR14/SG
TFR2 Flown Passengers Report
This report provides the number of flown passengers detailed by flight. This information is collected from the automatic check-in closing and defaults to the current date or a particular date.
The basic command to generate the report is the following:
TFR2
Response:
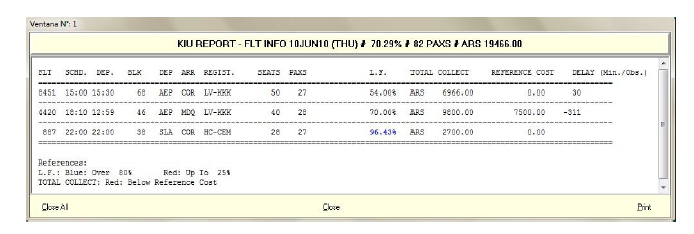
Description
| FLT | Flight |
| SCHD | Scheduled departure time |
| D.E.P. | Actual departure time |
| BLK | Real flight time .Time difference between departure and arrival time to destination is calculated |
| DEP | Origin |
| ARR | Destination |
| REGIST | Aircraft registration |
| SEATS | Number of seats allowed |
| PAXS | Number of transported passengers |
| L.F. | Flight load factor |
| TOTAL COLLECT | Total amount collected on the flight |
| DELAY(Min./Obs) | Delay time expressed in minutes and observations added. |
The average load factor of the requested date is shown in the report header as general information followed by the number of transported passengers.
By date
If the command is not set, it will default to the current date.
If you want to generate the report for a specific date, you must enter the following command:
TFR2/DATE
Notes:
Load Factor (L.F.) is obtained by dividing the P.K.T. (Passengers by traveled kms) by the A.K.O. (Seats per offered kms). The result is multiplied by 100 and the load factor is obtained.
Example with a flight with 2 or more legs:
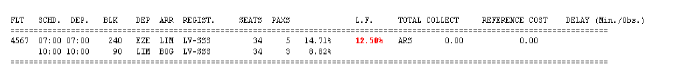
In flights of two or more legs,load Factor calculation is the same; however, it must be considered that subtotals are not added and divided by number of legs.
Below is an example of how the calculation of the LF is for a flight of several sections:
Flight 4112 (AEP / LIM / BOG), aircraft capacity 34 seats:
Distances:
AEP LIM: 3152 KM
LIM BOG: 1889 KM
Number of passengers:
AEP LIM 3
AEP BOG: 2
LIM BOG: 1
For Load Factor calculation the total number of passengers that embark at each airport and arrive at their destination are considered (for this reason BOG passengers are considered both in the calculation of the first and second legs)
.
In our example, the system considers 5 passengers for the BUE BOG leg and 3 passengers for the LIM / BOG leg.
Load factor calculation(PKT/AKO)
*AEP/LIM: PKT 15760 (5x3152) / AKO 107168 (34x3152)
*LIM/BOG: PKT 5667 (3x1889) / AKO 64226 (34x1889)
Load Factor BUE/LIM: 15760/535840 = 0.14705882 (14.71 %)
Load Factor LIM/BOG: 5667 / 64226 = 0,08823529 (8.82%)
Complete Load Factor Complete: 21427 (15725 + 5667) / 171394 (107168 + 64226) = 0.12501604
Full Flight Load Factor is 12.50%
Export
The following option can be used to export the report to a file separated by commas;while exporting the number of kilometers between each pair of cities will be seen in the last column of the file
TFR2-CSV
The kilometers information will be available only on the screen while exporting , and not in the report ,
TFR3 Flown passengers by date Report
This report provides the number of flown passengers on a particular date or period. It can be generated by entering the following command:
TFR3/DATE-DATE
Example:
TFR3/1JUL-10JUL
Description:
| TFR3 | Report identifier |
| / | Slash |
| DATE | Date "from" |
| - | Hyphen |
| DATE | Date "until" |
If when entering the command the system does not find information for the date indicated, the message will respond: NO DATA.
When entering the command the system will open a pop up with the information for the dates entered as shown below:
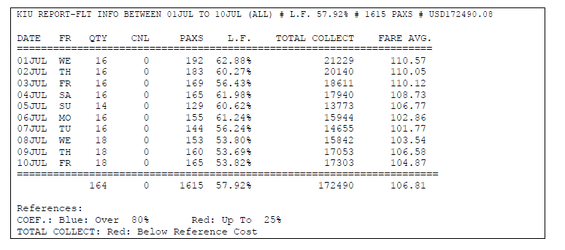
At the top of the report the following date will be displayed
- The date period indicated in the command (01JUL-10JUL)
- Queried period: if a frequency filter was entered it will be shown in parentheses, otherwise ALL will be displayed informing that all frequencies are included (days of the week)
- Load factor: is the general load factor of the day or period requested
- Number of passengers
- Currency and total amount of income
- Below the daily subtotals, the TOTAL can be displayed for the date or period entered in the command.
| FR | Flight frequency The two letters of the day will be displayed in English (MO: Monday TU: Tuesday WE: Wednesday TH: Thursday FR: Friday SA: Saturday SU: Sunday) |
| QTY | Represents the number of flights operating on each of the days |
| CNL | Number of flights canceled at check-in on each of the days |
| L.F. | Indicates load factor |
| PAXS | Number of traveled passengers |
| TOTAL COLLECT | Income for each of the dates(Only fares,taxes are not included) |
| FARE AVG | Average fare value is obtained by dividing the amount of the Total Collect column by the number of passengers (Paxs) |
| REFERENCE COST | Flight cost. This column will be displayed if the airline has added the flight costs. |
The load factor ,color references and the flight cost will be displayed at the bottom of the report.
Filter by Flight
To check the passengers transported on a particular flight, in a certain period, the following command should be entered:
TFR3{flight}/DATE-DATE
The flight number must be entered after the TFR3 report indicator.
Example:
TFR34176 / 01MAY-25MAY
In the previous example, information is being requested from passengers transported on flight 4176 between May 1 and May 25.
Note:
In order to generate the TFR reports the user must have duties 6 and / or 8 in the sign.
TFR4 FLOWN PASSENGERS BY FLIGHT REPORT
This report provides the number of flown passengers on a particular date or period. It can be generated by entering the following command:
TFR4/Date-Date
Example:
TFR4/1JUL-3JUL
Description:
| TFR4 | Report identifier |
| / | Slash |
| DATE | Date"from" |
| - | hyphen |
| DATE | Date"until" |
If no data is found for the date indicated in the command then the system will respond NO DATA.
If data is found a pop up will open with the corresponding information with the flown passengers for the date or period of dates entered in the command as shown below:
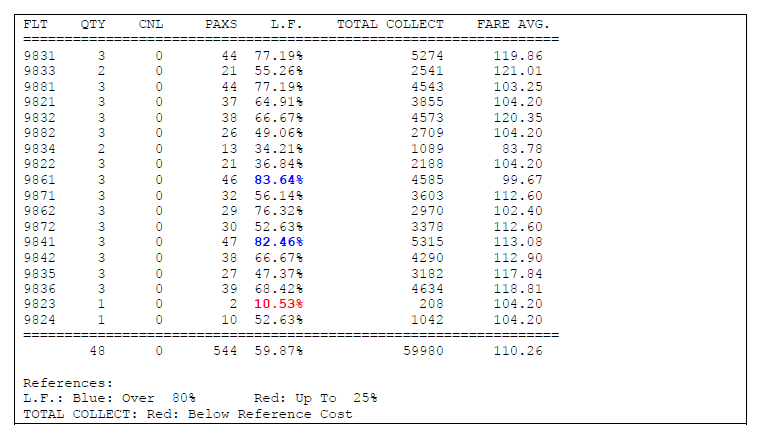
Description:
| FLT | Flight number |
| QTY | Represents the number of flights operated on each of the days |
| CNL | Number of flights canceled at check-in on each of the days |
| L.F. | Indicates load factor |
| PAXS | Number of traveled passengers |
| TOTAL COLLECT | Income for each of the dates(Only fares,taxes are not included) |
| FARE AVG | Average fare value is obtained by dividing the amount of the Total Collect column by the number of passengers (Paxs) |
The load factor color references and the flight cost will be displayed at the bottom of the report.
TFR5 FLOWN PASSENGERS BY FLIGHT SEGMENT REPORT
This report provides the number of passengers flown in each of the segments operated, on a particular date or a period.
It can be generated by entering the following command:
TFR5/DATE-DATE
Example:
TFR5/1JUL-10JUL
Description:
| TFR5 | Report identifier |
| / | Slash |
| DATE | Date"from" |
| - | hyphen |
| DATE | Date"until" |
If no data is found for the date indicated in the command then the system will respond NO DATA. This report displays the number of flown passengers for each of the flight segments
If data is found a pop up will open with the corresponding information with the flown passengers for the date or period of dates entered in the command as shown below:
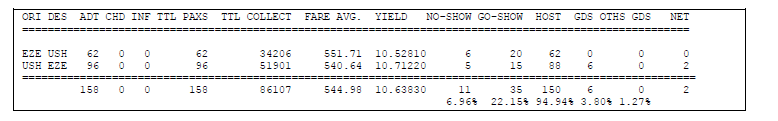
| ORI | Origin segment |
| DES | Destination segment |
| ADT | Number of adult passengers |
| CHD | Number of children passengers |
| INF | Number of infant passengers |
| TTL PAXS | Total number of passengers regarless of passenger type. |
| TTL COLLECT | Revenue from segment |
| FARE AVG | Average fare sold in a market |
| YIELD | Is the average fare per passenger per kilometer . Passenger revenue is calculated by dividing the total colletct by PKT (Passenger per traveled km) Measure of average fare paid per kilometer, per passenger, calculated by dividing total collect by PKT (Passenger per traveled km) |
| NO SHOW | Number of No show passengers in each segment |
| GO SHOW | Number of Go Show passengers in each segment |
| HOST | Number of flown passengers with tickets issued in the host |
| GDS | Number of flown passengers with tickets issued in KIU GDS |
| OTH GDS | Number of flown passengers with tickets issued in another GDS |
| NET | Number of flown passengers with tickets issued through the web. |
Below each segment detail the TOTAL of each of the indicators for all the segments reported is displayed.
Filters
The following filters may be added to the report for a more specific analysis:
Origin and Destination
This filter allows displaying the number of flown passengers on a particular segment. To check from ALL origins towards a particular destination, the entry is:
TFR5ALLBUE/DATE-DATE
In this example, flown passengers from any boarding point to BUE (Buenos Aires) are being checked. The segment filter must be entered followed by the report indicator TFR5.
To check a report from a particular origin to ALL destinations, the entry is:
TFR5BUEALL/DATE-DATE
In this example, flown passengers from BUE (Buenos Aires) to all destinations are being checked.
You can check a particular segment by entering the Origin and Destination airports-:
TFR5BUELIM / DATE-DATE
In this example,flown passengers from BUE (Buenos Aires) to LIM (Lima) are being checked.
When a particular segment is entered, the system will display the information corresponding to the segment indicated in the entry, and it will also show the information of the inverse leg for its comparison and analysis.
Flight and Segment
This filter displays flown passengers on a particular segment of a specific flight. The entry is as follows:
TFR53172AEPSLA/DATE-DATE
In this example, passengers transported in the AEP / SLA segment of flight 3172 are being consulted.
Segment filter must be entered followed by TFR5 report indicator.
Flight and / or detailed Segment
This filter displays flown passengers on a particular segment or a specific flight or both combinations by date or by a period of dates detailed day by day. The entry is as follows:
TFR53172AEPASLA/DATE-DATE+
In this example, passengers in the AEP / SLA segment of flight 3172 are being checked.
The segment filter must be entered after the TFR5 report indicator and a + indicator placed behind the last specified date. If there is no flight or route or both, the system will return the following error:
INVALID - DETAILED REPORT REQUIRES FLIGHT OR ROUTE
TFR6 Delays Report
This report provides the number of flights affected by delays on a particular /date or period with delay codes.
The report can be generated by entering the following command:
TFR6/DATE-DATE
Example:
TFR6/1JUL-10JUL
Description:
| TFR6 | Report identifier |
| / | Slash |
| DATE | Date"from" |
| - | hyphen |
| DATE | Date"until" |
If no data is found for the date indicated in the command then the system will respond NO DATA.
If data is found a pop up will open with the corresponding delay information for the date or period of dates entered in the command as shown below:
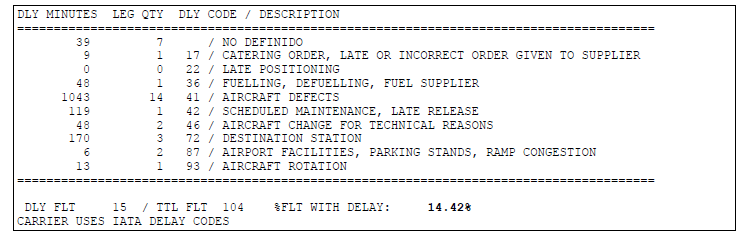
| DLY MINUTES | Minutes of delay per each delay code |
| LEG QTY | Number of flights affected by the delay |
| DLY COD | Delay code entered in the takeoff message (PMD). Keep in mind that if the flight is delayed and a delay code is not indicated, no code will be displayed in the explanation of the delay reason . NOT DEFINED message will be displayed |
| DESCRIPTION | In this column, the standard IATA code with the description for each code will be displayed. To visualize this description, you must first configure the IATA DELAY CODE option with the YES option in the JJSTAT control. |
| DLY FLT | Number of delayed flights. Keep in mind that this data is not the sum of the LEG QTY column (segments), but the number of flights delayed on the date or period consulted. |
| TTL FLT | Number of operational flights (canceled flights are not included) |
| FLT WITH DELAY | Percentage of operational flights with delay(canceled flights are not included) |
The last line of the report provides the total number of flights with delayed departures (15 in the example) and the total operational flights operated in the verified period (104 in the example); and the percentage of flights that were delayed (14.42% in the example).
Also If the airline has set up delay messages in the JJSAT table .CARRIER USES IATA DELAY CODES will be displayed, otherwise this text will not be displayed.
Filters
In the delays report , the following filters may be applied for a more detailed analysis:
Flight
This filter displays delays suffered by a particular flight. The entry is as follows:
TFR63140/DATE-DATE
In this example, delays on flight 3140 are checked for a period of time.
In the information display , the applied filter can be seen : FILTER BY FLIGHT: 3140
Detail by Flight
This filter allows generating a report adding details of the operational and delayed flights.
The entry is as follows:
TFR6F/DATE-DATE
In order to display the delay associated with flight numbers the F(flight indicator) must be added to the command.
Keep in mind that by adding the F indicator, the numbers of flights will be displayed, both those that had delays and those that departed on time. The same flight number may appear several times repeated, if in the checked period some days were on time and some others delayed with different IATA codes delays.
Detail by boarding point
This filter displays delays according to the boarding point.
The entry is as follows:
TFR6B / DATE-DATE
B(boarding point) must be added to the command in order to display delays associated to the boarding point or the departure airport.
Keep in mind that when adding B indicator, both the airport codes for flights with delays and also those that departed on time will be displayed . The same flight number may appear repeated several times, if in the checked period some days were on time and some others delayed with different IATA codes delays.
Considerations:
1. The system considers delays the period between 1 minute and 720 minutes (12 hours) after the scheduled departure time. If the delay is greater than 12 hours, the system ignores this delay due to a possible incorrect entry of data.
2. Flights that depart before their scheduled time are not taken into account for the calculation of delays.
3. Flights that have more delay than the tolerance configured in the JJSTAT (See General Information Manual) will be reported in the TFR6 with the minutes exceeding the tolerance.
TFR8 Passengers Flown by segments and point of sale Report
TFR 8 report provides the number of flown f passengers by segments, grouped according to the point of sale where the ticket was issued.
The report provides the number of tickets issued and flown by segments, as well as the percentage represented by the number of tickets issued in interline agreements and code-share flights.
The command to generate the report is the following:
TFR8 / <DATE>
Examples:
TFR8 / 01JAN A specific date
TFR8 / 01JAN-04JAN A period of dates
TFR8VVICBB / 01JAN A particular segment on a specific date
TFR8VVICBB / 01JAN-4JAN A particular segment in a period of dates
TFR8175 / 01JAN A particular flight on a specific date
TFR8175 / 01JAN -04JAN A particular flight in a period of dates
TFR8175VVICBB / 01JAN A flight / segment in particular on a specific date
TFR8175VVICBB / 01JAN-04JAN A particular flight / segment in a period of dates
TFR8175 / 01JAN-04JAN + A specific flight with detail per day
TFR8VVICBB / 01JAN-04JAN + A particular segment with detail per day
TFR8175VVICBB / 01JAN-04JAN + One flight / segment in particular with detail per day
Note: you can use the same filters and extensions that apply for the TFR5 report .
When executing the command, the system will display an pop-up with the corresponding data according to the indicated filters, as shown below:
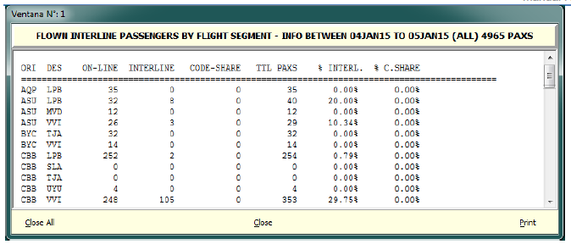
| ORI | Origin Segment |
| DES | Destination Segment |
| ON-LINE | Flown passengers whose ticket were issued in the host |
| INTERLINE | Flown passengers whose tickets were purchased on another airline with interline agreement |
| CODE SHARE | Passengers who purchased their ticket on a code-share flight |
| TTL PAXS | Total flown passengers by segment |
| % INTERL. | Ticket percentage issued through interline agreements |
| % C.SHARE | Percentage of tickets issued on code share flights. |
TFR9 Flown Passengers by Segment, according to Check-In Method
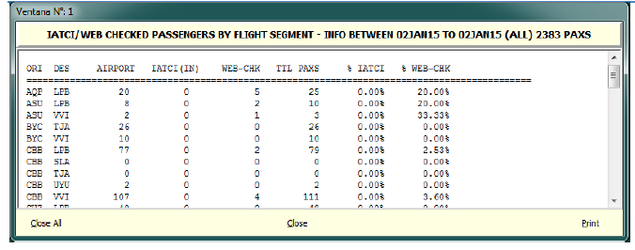
TFR 9 report provides the number of flown passengers by segments, grouped according to the way the boarding pass was obtained.
- AIRPORT: boarding passes issued at the airports by the airline itself
- IATCI (IN): boarding passes issued by other airlines (interline connection)
- WEB CHECK-IN: boarding passes issued through the airline's website
The report will display the number of tickets issued and flown by segments, as well as the percentage that represents the number of boarding passes that were issued by other airlines (IATCI) and through the web check-in.
The command to generate the report is the following:
TFR9/<DATE>
TFR9 / 01JAN A specific date
TFR9 / 01JAN-04JAN A period of dates
TFR9VVICBB / 01JAN A specific segment and date
TFR9VVICBB / 01JAN-4JAN A specific segment in a period of dates
TFR9175 / 01JAN A specific flight and date
TFR9175 / 01JAN -04JAN A specific flight in a period of dates
TFR9175VVICBB / 01JAN A specific flight / segment and date
TFR9175VVICBB / 01JAN-04JAN A specific flight / segment  in a period of dates
TFR9175 / 01JAN-04JAN + A specific flight with detail per day
TFR9VVICBB / 01JAN-04JAN + A specific segment with detail per day
TFR9175VVICBB / 01JAN-04JAN + A specific flight / segment with detail per day
When executing the command, the system will display an pop-up with the corresponding data according to the indicated filters, as shown below:
Description:
| ORI | Origin segment |
| DES | Destination segment |
| AIRPORT | Passengers checked-in at the carrier' s own counters |
| IATCI(IN) | Passengers check-in by other airlines(interline connection) |
| WEB-CHK | Passengers checked-in through the airline's website |
| TTL PAXS | Total flown passengers |
| % IATCI | Percentage of passengers checked-in by other airlines. |
| % WEB-CHK | Percentage of passengers checked-in through the web |
TFR10 Flown passengers by segment and issuing carrier(Interline or code share)
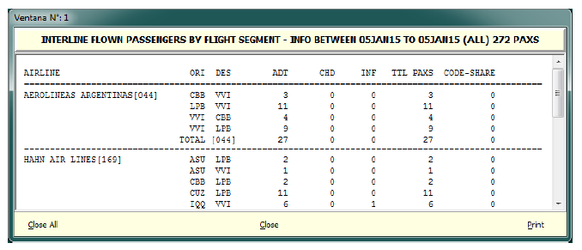
TFR 10 report provides the number of flown passengers by segments issued through interline agreements.
The command to generate the report is the following:
TFR10/<DATE>
Examples:
TFR10 / 01JAN A specific date
TFR10 / 01JAN-04JAN A period of dates
TFR10VVICBB / 01JAN A specific segment and date
TFR10VVICBB / 01JAN-4JAN A specific segment in a period of dates
TFR10175 / 01JAN A specific flight and date
TFR10175 / 01JAN -04JAN A specific flight in a period of dates
TFR10175VVICBB / 01JAN A specific flight / segment and date
TFR10175VVICBB / 01JAN-04JAN A specific flight / segment  in a period of dates
TFR10175 / 01JAN-04JAN + A specific flight with detail per day
TFR10VVICBB / 01JAN-04JAN + A specific segment with detail per day
TFR10175VVICBB / 01JAN-04JAN + A specific flight / segment with detail per day
When executing the command, the system will display an pop-up providing the number of passengers who have purchased their tickets through an interline agreement, and grouped by flight segment (origin / destination), as shown below:
Description;
| AIRLINE | Airline name with accounting code |
| ORI | Origin segment |
| DES | Destination segment |
| ADT | Number of flown adult passengers |
| CHD | Number of flown children passengers |
| INF | Number of flown infants passengers |
| TTL PAXS | Total number of flown passengers (adt+chd+inf) in each segment |
| CODE SHARE | Total number of flown passengers on code-share flights |